
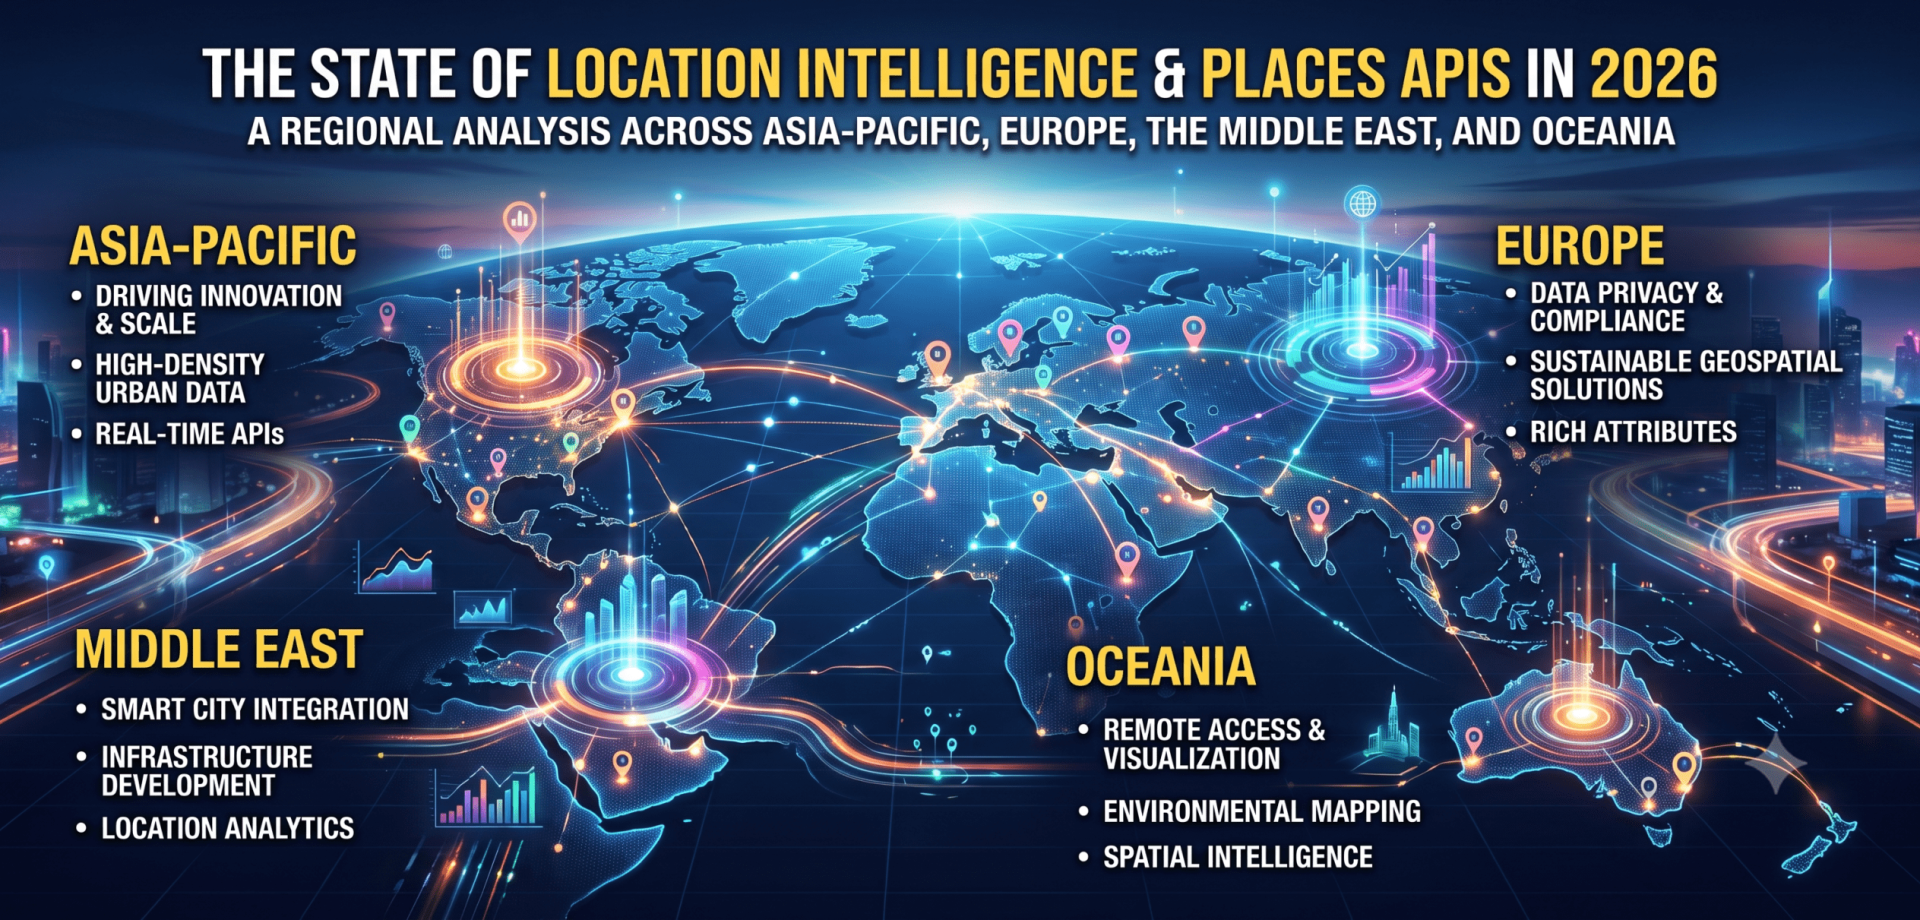
A Regional Analysis Across Asia-Pacific, Europe, the Middle East, and Oceania
Location has become a first-class dimension of enterprise data. Every parcel scanned, every ride requested, every store visited now carries coordinates alongside its timestamp, and the industry built to turn those coordinates into decisions has quietly grown into one of the more consequential software categories of the decade. According to Global Growth Insights, global location intelligence revenue is on track to reach roughly USD 28.72 billion in 2026 and is projected to expand to USD 109.46 billion by 2035, growing at a compound annual rate close to 16 percent. A parallel forecast from Grand View Research places the market at USD 27.9 billion in 2026 and USD 76.4 billion by 2033, with a slightly more conservative 15.5 percent CAGR.
Both figures land in the same range. This is a market roughly doubling every four to five years. The story becomes more interesting when broken apart by region. North America remains the incumbent, holding around 38 percent of global revenue, but its lead is being narrowed by ecosystems that started later and grew from different foundations. Asia-Pacific runs on rapid urbanization. Europe runs on regulation. The Middle East runs on national vision documents. Oceania runs on a policy layer that has quietly turned geospatial infrastructure into an economic asset class in its own right.
The Global Baseline
The market where the money sits in 2026
Roughly 72 percent of enterprises now integrate spatial analytics into their operations, 68 percent of retailers report using geospatial insights for merchandising or site selection, and 63 percent of logistics firms rely on mapping platforms for routing and fleet management, according to Global Growth Insights. Location intelligence has passed the point of being a specialist tool. It has become general infrastructure.
Regional revenue shares in 2026 look roughly as follows: North America 38 percent, Europe 27 percent, Asia-Pacific 25 percent, and Middle East and Africa combined about 10 percent. What the shares hide is trajectory. Asia-Pacific is expected to post the highest regional CAGR through the next decade, driven by a combination of urban expansion, cloud infrastructure buildout, and public-sector deployment.
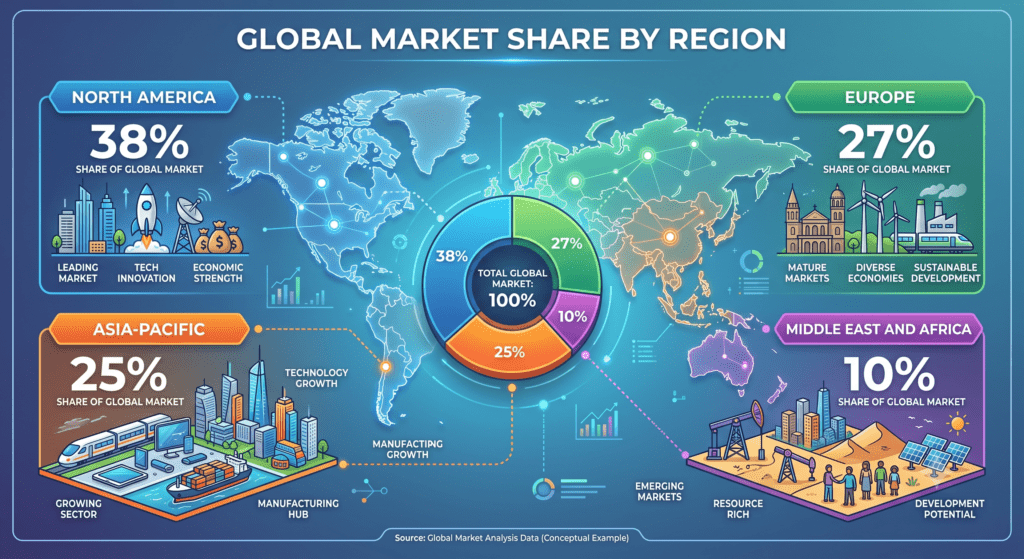
Figure 1. Global location intelligence revenue by region (2026 estimates)
| Region | Share of Global Market |
|---|---|
| North America | 38% |
| Europe | 27% |
| Asia-Pacific | 25% |
| Middle East and Africa | 10% |
Total global market: USD 28.72 billion in 2026.
Source: Global Growth Insights, Location Intelligence Market Report (2026); cross-referenced with Grand View Research (2026).
Asia-Pacific
Growth measured in cranes and cell towers
Asia-Pacific is projected to record a market value of USD 5.28 billion in 2026 with the highest CAGR of any global region, according to Fortune Business Insights. China alone is estimated at USD 7.22 billion under a broader location intelligence segmentation from Business Research Insights, making it the single largest national market in the region and among the largest in the world. Japan follows at approximately USD 1.00 billion in 2026, roughly 4.2 percent of global revenue.
The engine here is not enterprise digitization but urban construction. Asia-Pacific smart city spending was estimated at USD 198.85 billion in 2025 and is projected at USD 257.42 billion in 2026, with the China smart city market alone expected to touch USD 84.63 billion, Japan USD 54.67 billion, and India USD 53.98 billion in the same year, per Fortune Business Insights. Every metro line, energy grid, and land-use policy in these projects produces spatial data, and location intelligence platforms are the layer that operationalizes it.
Asia-Pacific location intelligence is projected to grow at 19 percent CAGR through 2030, driven less by enterprise adoption than by public-sector infrastructure buildout.
Grand View Research pegs the Asia-Pacific location intelligence CAGR at 19 percent from 2025 to 2030. Coherent Market Insights forecasts Asia-Pacific to hold roughly 29 percent of global market share by 2026, up from historically lower levels, driven by precision agriculture, environmental monitoring, and telecom infrastructure expansion. Country-specific investments back these projections. India’s Smart Cities Mission covers over 100 cities, China continues its New Urbanization Plan with dedicated smart city zones, and Japan’s national digital twin program is expanding coverage of high-resolution three-dimensional urban models.
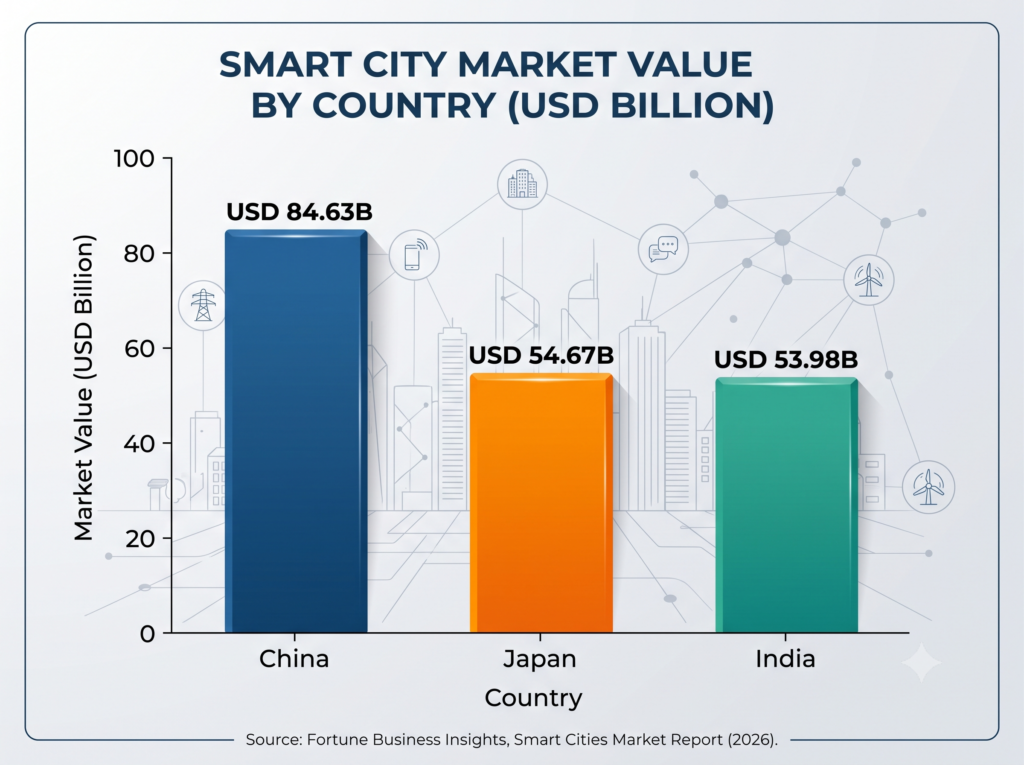
Figure 2. Asia-Pacific smart city market by country (2026 estimates)
| Country | Smart City Market Value |
|---|---|
| China | USD 84.63B |
| Japan | USD 54.67B |
| India | USD 53.98B |
Source: Fortune Business Insights, Smart Cities Market Report (2026).
Europe
The market shaped by rules
Europe is projected to reach USD 6.07 billion in location intelligence revenue in 2026, second only to North America in absolute terms, and is expected to grow at 13.2 percent CAGR through the forecast period, according to Fortune Business Insights. The United Kingdom leads European national markets at USD 1.23 billion, followed by Germany at USD 1.10 billion. A wider Europe location analytics view from Market Data Forecast puts the total at USD 7.86 billion in 2026, rising to USD 21.06 billion by 2034 at a compound rate of 13.11 percent.
The European story is defined less by build-out and more by governance. According to Eurostat data referenced in industry reports, over 70 percent of European businesses now use geospatial data in their operations. But data usage in Europe operates inside the tightest privacy framework in the world. Cumulative GDPR fines have reached EUR 5.88 billion since the regulation took effect in 2018, and the European Data Protection Board has flagged Article 17 erasure requests, dark patterns, and AI processing as 2026 enforcement priorities, as detailed by Secure Privacy. Location data, being both personal and behavioral, sits in the highest-scrutiny category.
Key European Indicators
| Metric | Value |
|---|---|
| Europe Market Size, 2026 | USD 6.07B |
| Regional CAGR | 13.2% |
| Businesses Using Geospatial Data | Over 70% |
| Cumulative GDPR Fines Since 2018 | EUR 5.88B |
This shapes vendor selection. European retailers and marketplaces increasingly prefer providers with EU-hosted infrastructure and no downstream commercial conflict. Woosmap, based in France, is often cited as the leading challenger to Google Maps Platform in EU retail contexts precisely because it offers pure infrastructure without competing consumer verticals. TomTom (Netherlands), HERE Technologies with strong European automotive presence, and Hexagon (Sweden) round out an unusually well-developed local vendor ecosystem, alongside SAP, Ariadne Maps, Geoblink, Galigeo, and CARTO.
Industry 4.0 adoption is a secondary driver. Germany’s manufacturing sector uses location intelligence for supply chain visibility, asset management, and factory floor optimization at some of the highest rates globally.
The Middle East
Sovereign scale, sovereign speed
The Middle East and Africa combined location intelligence market is projected at USD 1.95 billion in 2026, with the GCC alone accounting for USD 0.62 billion, according to Fortune Business Insights. The regional CAGR sits at approximately 19.6 percent, among the highest of any global region tracked by industry surveys, as documented by Memob. Within the GCC, the United Arab Emirates leads with roughly 42 percent regional share, Saudi Arabia at 37 percent, Qatar at 12 percent, and other members making up the balance.
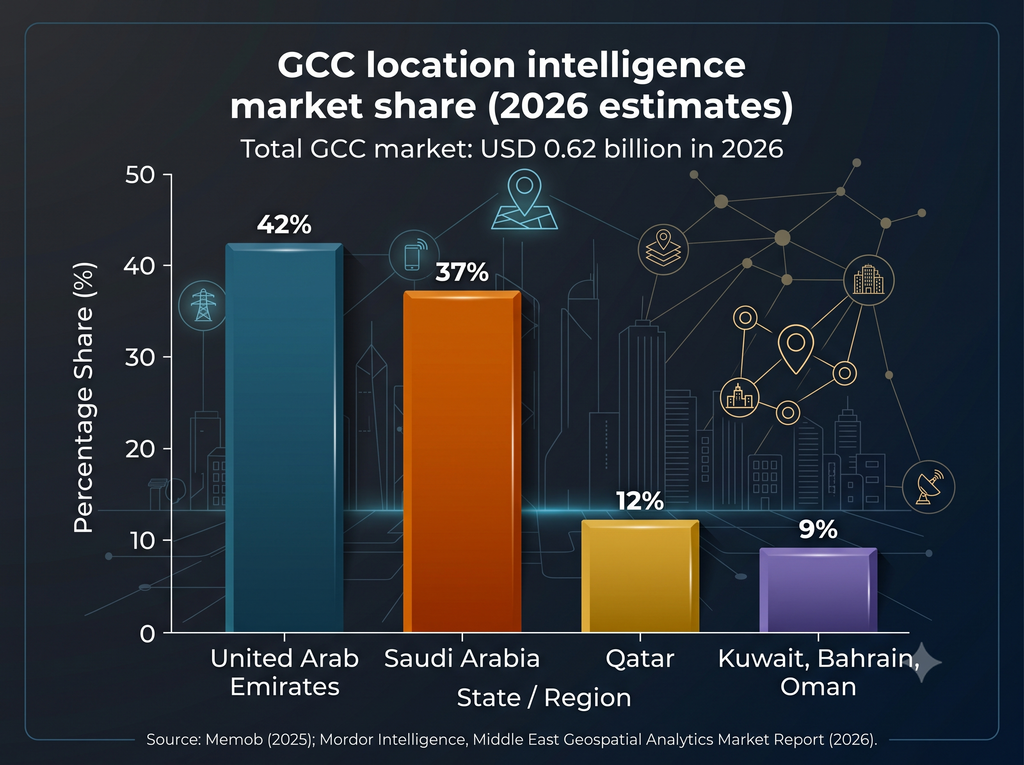
Figure 3. GCC location intelligence market share (2026 estimates)
| State | Share of GCC Market |
|---|---|
| United Arab Emirates | 42% |
| Saudi Arabia | 37% |
| Qatar | 12% |
| Kuwait, Bahrain, Oman | 9% |
Total GCC market: USD 0.62 billion in 2026.
Source: Memob (2025); Mordor Intelligence, Middle East Geospatial Analytics Market Report (2026).
The Middle East geospatial analytics market specifically stands at USD 5.37 billion in 2026 and is forecast to reach USD 7.87 billion by 2031 at a 7.95 percent CAGR, per Mordor Intelligence. Saudi Arabia holds 41.25 percent of that regional revenue, buoyed by Vision 2030 and multi-billion-dollar digital twin investments in NEOM, Riyadh, and the Red Sea Project. Cloud deployment shows the highest sub-segment CAGR at 11.18 percent as sovereign data-center capacity comes online and localization requirements ease.
The distinguishing feature of the Middle East market is the tight coupling between location intelligence adoption and national policy. Saudi Arabia earmarked more than SAR 113 billion (about USD 30.1 billion) for ICT over a three-year horizon, and its 2026 budget explicitly prioritizes AI and digital administration, according to Mordor Intelligence. The UAE’s National AI Strategy 2031 and its Falcon and Jais 2 Arabic language models operate alongside the operational Oracle UAE Central and UAE East cloud regions, with a Microsoft Saudi Azure region reaching general availability in Q4 2026. New land-registration statutes across the GCC require sub-meter accuracy and cryptographic audit trails, pushing agencies toward cloud-enabled spatial data infrastructures.
The result is that location intelligence in the Middle East is bought at government scale before it filters out to enterprises. Bayanat in the UAE, GeoTech in Saudi Arabia, and the UAE Space Agency’s Geospatial Analytics Platform are examples of state-backed capacity rather than pure private-sector plays, as noted by Credence Research.
Oceania
Small market, measured ambition
Oceania’s numbers are smaller in absolute terms but the strategic sophistication is disproportionate. The Australia and New Zealand location-based services market reached USD 2.93 billion in 2026 and is projected to rise to USD 6.83 billion by 2031, according to Mordor Intelligence. The narrower ANZ geospatial analytics market is estimated at USD 0.8 billion in 2026. Australia dominates with about 74.6 percent of regional revenue, while New Zealand is projected to grow fastest at 11.35 percent CAGR through 2031.
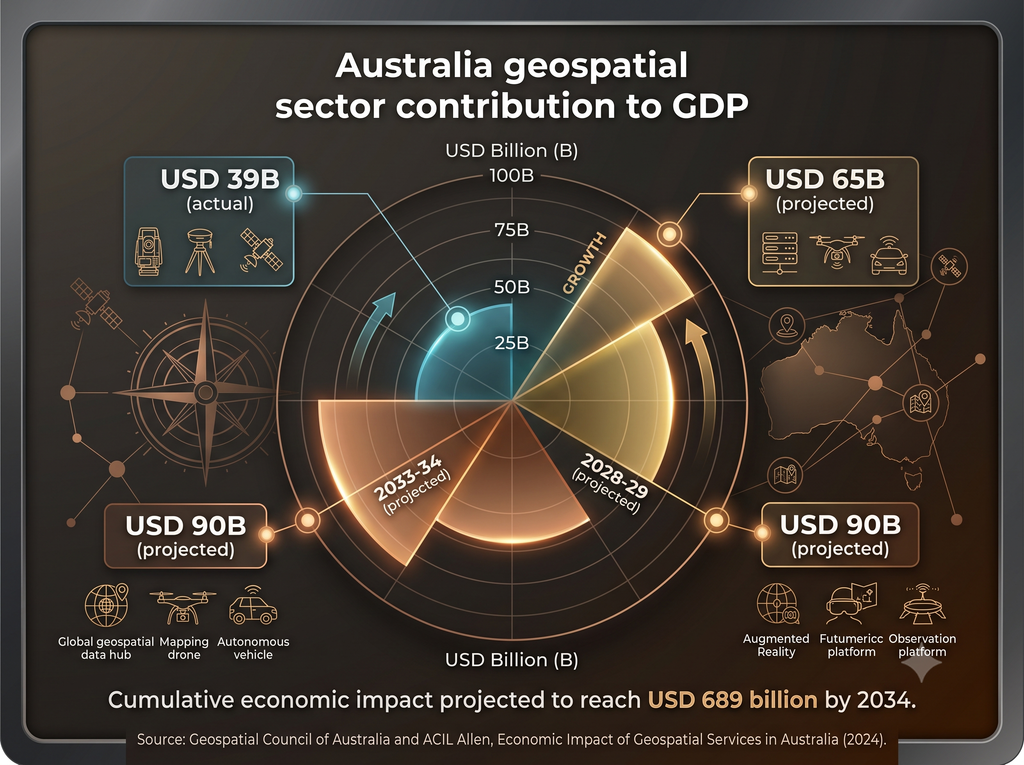
Figure 4. Australia geospatial sector contribution to GDP
| Financial Year | Annual GDP Contribution |
|---|---|
| 2023-24 (actual) | USD 39B |
| 2028-29 (projected) | USD 65B |
| 2033-34 (projected) | USD 90B |
Cumulative economic impact projected to reach USD 689 billion by 2034.
Source: Geospatial Council of Australia and ACIL Allen, Economic Impact of Geospatial Services in Australia (2024).
What makes the region distinctive is its quantified national commitment. The Geospatial Council of Australia’s landmark 2024 economic impact study, conducted by ACIL Allen, found that geospatial technology contributed USD 39 billion to Australia’s GDP in the 2023-2024 financial year and supports over 12,000 full-time jobs. By 2033-2034, under a favorable operating scenario, that annual contribution is projected to reach USD 90 billion with an additional 32,000 jobs, and the cumulative economic impact is estimated at USD 689 billion. Few other governments have quantified the sector at this level of detail.
The infrastructure underneath supports the ambition. Australia’s 2025-2026 federal budget allocated USD 17.1 billion for road and rail upgrades and USD 1.85 billion for fiber network completion. New Zealand’s SouthPAN system delivers sub-meter GNSS accuracy across the country, enabling autonomous machinery and precision navigation. New Zealand also granted each mobile operator 80 MHz of 3.5 GHz spectrum, allowing dense private 5G deployment. Spark New Zealand and Air New Zealand activated the country’s first private 5G network at Auckland Airport in May 2025, powering nightly drone-based inventory audits that previously required quarterly manual counts. HERE Technologies and AWS have signed a USD 1 billion partnership to accelerate AI mapping in the region.
The Places API Layer
Who owns the developer interface
Underneath all of this sits the Places API layer: the developer-facing interfaces that resolve names to coordinates, autocomplete addresses, and surface metadata about businesses, landmarks, and administrative boundaries. Google Maps Platform holds roughly 61.3 percent global market share by usage across websites, making it the default choice for most developers and most consumer applications, according to APIScout. Mapbox holds approximately 26.94 percent of the mapping and GIS competitor share, offering greater customization and 50 to 60 percent lower unit pricing at scale for teams willing to trade brand recognition for control, per 6sense.
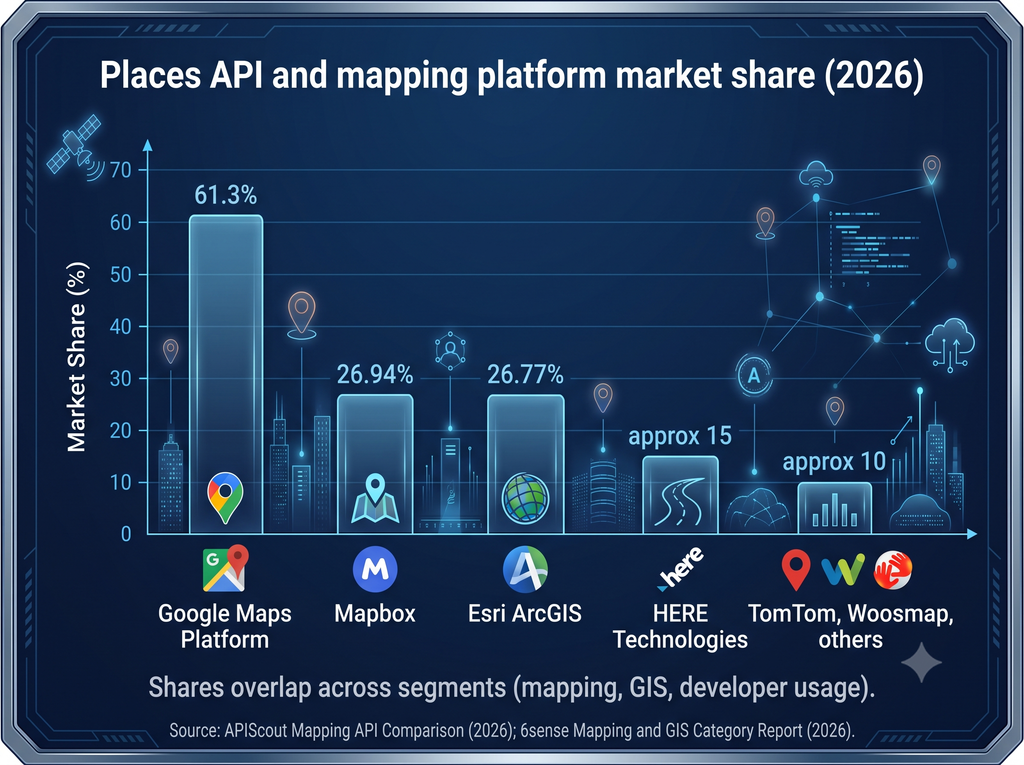
Figure 5. Places API and mapping platform market share (2026)
| Provider | Market Share |
|---|---|
| Google Maps Platform | 61.3% |
| Mapbox | 26.94% |
| Esri ArcGIS | 26.77% |
| HERE Technologies | approx 15% |
| TomTom, Woosmap, others | approx 10% |
Shares overlap across segments (mapping, GIS, developer usage).
Source: APIScout Mapping API Comparison (2026); 6sense Mapping and GIS Category Report (2026).
Beyond these two, the market is specialized by segment. HERE Technologies, backed by BMW, Audi, and Mercedes-Benz, dominates automotive and fleet routing with deep truck-specific constraint modeling, hazmat routing, and EV charge-aware routing. TomTom is the reference for real-time traffic in Europe. Woosmap is the challenger in EU retail marketplaces. Radar has cornered geofencing, trip tracking, and fraud detection. Loqate is the address validation specialist in the UK and Europe. Esri’s ArcGIS holds 26.77 percent of the mapping and GIS category.
For regional decision-makers, the practical implication is that no single provider dominates all use cases, and vendor selection increasingly follows regulatory and industrial context rather than technical feature parity.
Regional Data at a Glance
Table 1. Regional location intelligence markets, 2026
| Region | 2026 Size | CAGR | Lead Country |
|---|---|---|---|
| Asia-Pacific | USD 5.28B | 19.0% | China (USD 7.22B, 2025) |
| Europe | USD 6.07B | 13.2% | United Kingdom (USD 1.23B) |
| Middle East and Africa | USD 1.95B | 19.6% | UAE and Saudi Arabia (GCC: USD 0.62B) |
| Oceania (ANZ) | USD 0.80B | 18.4% | Australia (74.6% share) |
Source: Fortune Business Insights, Mordor Intelligence, Business Research Insights, and Grand View Research (all 2026).
Outlook
What connects the four
The four regions surveyed here will not converge on a single pattern of adoption. Asia-Pacific will keep leading in raw growth as urbanization compounds. Europe will keep leading in regulatory sophistication, which increasingly means keeping trust with users at the core of vendor selection. The Middle East will keep tying location intelligence to sovereign national programs whose spending is measured in the tens of billions. Oceania will keep publishing the kinds of quantified economic impact studies that make the sector legible to legislators.
Location has stopped being a category of software and has started behaving like a substrate.
The connecting thread is that location has stopped being a category of software and has started behaving like a substrate. Precision agriculture, autonomous mobility, delivery logistics, insurance underwriting, defense, and retail siting all now flow through spatial platforms, and each of them is picking a regional favorite from a menu that no longer looks the same in every country. The next five years will be less about whether location intelligence matters and more about whose data, whose infrastructure, and whose governance framework earns the trust of each region’s enterprises. On current evidence, none of the four is willing to accept the answer from anywhere else.
Conclusion
Location intelligence has moved from a niche analytics category into general enterprise infrastructure, and the pace of that shift now varies dramatically depending on which region is asking the question. Asia-Pacific’s growth is a byproduct of physical build-out at unprecedented scale. Europe’s is a byproduct of some of the world’s most demanding data protection rules meeting a mature enterprise base. The Middle East’s is a byproduct of sovereign programs willing to invest in geospatial capacity ahead of private demand. Oceania’s is a byproduct of a rare policy commitment to measuring the sector in the same terms it measures agriculture or mining.
Organizations like Potters Maps that are investing today in better geocoding, richer place attributes, sovereign-compliant hosting, and AI-driven location intelligence are positioning themselves to serve the four different demand patterns above with the same underlying platform. In a market where the numbers are getting harder to ignore and where regional buyers are getting harder to serve with a single global template, that kind of adaptable capacity is the strategic asset the next decade will reward.
Sources and Credits
Global Growth Insights. Location Intelligence Market Report, March 2026. globalgrowthinsights.com
Grand View Research. Location Intelligence Market Size, Share Report 2026-2033, June 2026. grandviewresearch.com
Fortune Business Insights. Location Intelligence Market Report, June 2026. fortunebusinessinsights.com
Fortune Business Insights. Smart Cities Market Report, 2026. fortunebusinessinsights.com
Coherent Market Insights. Location Intelligence Market Size, Share and Forecast 2033. coherentmarketinsights.com
Market Data Forecast. Europe Location Analytics Market Report, June 2026. marketdataforecast.com
Business Research Insights. Location Intelligence Market Size and Trend Report, 2035. businessresearchinsights.com
Mordor Intelligence. Middle East Geospatial Analytics Market Report, January 2026. mordorintelligence.com
Mordor Intelligence. ANZ Location-based Services Market Report, January 2026. mordorintelligence.com
Mordor Intelligence. Middle East Digital Transformation Market Forecasts to 2031. mordorintelligence.com
Geospatial Council of Australia and ACIL Allen. Economic Impact of Geospatial Services in Australia, October 2024. geospatialcouncil.org.au
Memob. The Ultimate Guide to Location Intelligence in GCC, September 2025. memob.com
Credence Research. Middle East Geospatial Analytics Market Report, 2025. credenceresearch.com
Secure Privacy. GDPR Compliance in 2026: The Complete Guide, 2026. secureprivacy.ai
Woosmap. Google Maps Competitors in 2026, June 2026. woosmap.com
APIScout. Google Maps vs Mapbox: Mapping APIs in 2026, March 2026. apiscout.dev
6sense. Google Maps Platform Market Share in Mapping and GIS, 2026. 6sense.com
Disclaimer :
Data compiled from public market research reports and industry disclosures. Where estimates differ across sources, the most recently published figure has been preferred. Figures rounded for clarity. All financial values are expressed in United States dollars unless otherwise noted.