
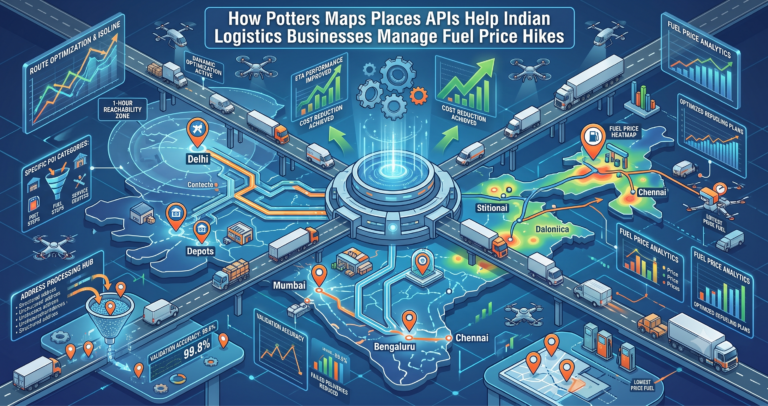
Diesel and petrol together make up the largest variable cost line in almost every Indian logistics and last mile delivery operation. According to industry commentary in BW Businessworld, fuel typically accounts for 20 to 30 percent of last-mile operating expenses in India, and for long-haul road freight the diesel share of total operating cost can rise to 40 to 50 percent. When retail prices spike, that cost line moves within days.
The Petroleum Planning and Analysis Cell of the Ministry of Petroleum and Natural Gas publishes daily retail selling prices of petrol and diesel across the metros and every state, with the price build-up broken down into base price, dealer commission, central excise duty, state VAT, and retail selling price. As the PRS India blog on Petrol and Diesel Prices documents with detailed charts, Indian retail prices have moved substantially over the years in response to global crude oil price shifts, tax adjustments, and rupee movements. At a global level, IEA analysis in the Global Energy Review 2025 identifies India as the largest single source of global oil demand growth in 2024, meaning Indian operators remain structurally exposed to volatility.
What operators can control is the number of litres consumed per delivery. That is not a fuel problem. It is a location intelligence problem. This article looks at how the Potters Maps Places APIs help Indian delivery and logistics businesses cut fuel consumption at every layer of their operation.
Every delivery route in India contains fuel that produces revenue and fuel that does not. The former is unavoidable. The latter is where the savings live. Fuel spent on backtracking after a wrong turn on a narrow lane, on driving to a wrong address in a colony with confusing numbering, on idling while a rider hunts for the correct gate in a large gated community, on repeat trips because an initial delivery failed, on unnecessary depot legs, and on driving further than needed because the nearest dark store was placed suboptimally, is all fuel that could have stayed in the tank.
As Petroleum Planning And Analysis Cell (PPAC), Government of India, retail price data makes plain, the cost of that wasted fuel is not constant. Under India’s daily price revision mechanism, retail diesel and petrol prices move regularly with global crude and rupee movements. Every operational inefficiency that consumes an extra litre becomes progressively more expensive during spikes and quietly erodes margin during periods of moderate elevation.
Route optimization engines calculate travel times and distances based on the coordinates they receive for each stop. If those coordinates are imprecise, the routes they produce incorporate small errors at each stop, and riders burn extra fuel correcting them on the road. In India, where address complexity varies enormously between formal urban colonies, dense unplanned settlements, and rural hamlets, coordinate precision matters more than in markets with rigid postal grids.
The Potters Maps Forward Geocoding API returns coordinates that correspond to the actual delivery entrance rather than approximated street centroids. Across a fleet running dozens of routes a day across Delhi, Mumbai, Bengaluru, Hyderabad, or Chennai, this precision translates directly into fewer corrective drives and fewer extra kilometres. When retail diesel trades in the ninety-rupee-per-litre plus range, these small savings compound quickly into a meaningful reduction in the total litre count.
A failed delivery is one of the most expensive fuel events in Indian logistics, because it consumes fuel on the original attempt without producing revenue, then again on the second attempt. Indian addresses are structurally complex, mixing house numbers, block references, colony names, landmark descriptions, and multiple locality tiers. An incomplete, ambiguous, or wrong entry at intake propagates through routing, dispatch, and execution before revealing itself as a failure at the doorstep.
The Potters Maps Autocomplete API prevents most of these errors at the point of entry by surfacing validated address candidates as the customer types. The Potters Maps Address Validation API catches errors arriving through bulk imports, seller integrations, or legacy migrations, and its NLP-driven approach handles the informal landmark-and-colony-heavy address styles common in Indian input rather than rejecting them. Every address validated at intake is a delivery that will not require a second fuel-consuming attempt.
Even a well-planned route can drift into fuel waste during execution. Riders taking unofficial detours, idling longer than necessary at pickup points, or moving off-plan without visibility for the dispatcher all consume fuel that a properly monitored operation would catch. The Potters Maps Reverse Geocoding API converts the continuous stream of GPS pings from each rider’s device into readable address updates that dispatchers can interpret at a glance.
This visibility supports fuel-aware operational review. When post-trip data is analysed, reverse-geocoded location traces let operations teams identify specific streets, market clusters, or route segments where actual travel diverged from planned travel. In dense Indian metros where a single wrong turn can add ten minutes of stop-and-start traffic to a stop, this closed-loop review is one of the most cost-effective tools available for eliminating recurring sources of fuel waste.
For long-distance and inter-city routes in India, where drivers refuel during the day, the choice of fuel station has a direct cost impact. Fuel prices in India vary meaningfully between states because of differing VAT rates, and even neighbouring stations can price differently depending on the operating oil marketing company (Indian Oil, BPCL, or HPCL). Choosing a station on the planned route reduces detour fuel to zero.
The Potters Maps Search API, drawing from the Potters Maps places database of over 70 million points of interest across multiple countries and territories, supports this planning by allowing dispatchers and drivers to query for fuel stations within a defined radius or corridor and choose the option that minimises both fuel spend and detour distance. On routes crossing state boundaries with substantially different VAT structures, this becomes a real operational lever, and PPAC state-wise retail price data makes the size of that lever quantifiable.
Every minute a rider spends idling while searching for the correct gate, tower, or shop is a minute of fuel burnt without productive movement. In dense Indian urban environments with sprawling gated communities, multi-tower apartment complexes, and market clusters with repetitive storefronts, this final-metres search can add cumulative fuel-wasting minutes to every stop.
The Potters Maps Location Image API provides imagery associated with specific points of interest, giving riders a visual reference for each destination before they arrive. Instead of idling while circling a residential complex looking for the correct tower, the rider identifies the correct entrance from the on-screen image and pulls in directly. Multiplied across a full route and a full fleet operating in Indian cities where traffic density magnifies every extra minute, this visual layer removes a significant amount of idle-search fuel from the daily consumption profile.
Beyond individual deliveries, the structural fuel consumption of a logistics operation is set by the placement of its hubs, dark stores, and consolidation centres. In the Indian quick commerce category, where sub-30-minute delivery promises are becoming the norm in major metros, dark store placement is often the single largest determinant of fleet fuel consumption. Hubs placed too far from demand clusters force every route to include unnecessary approach and return legs, and every one of those legs consumes fuel that better placement would eliminate.
The Potters Maps Search API and the underlying 70 million point of interest places database support strategic network planning by allowing operators to model demand density, candidate hub locations, and access to the local road network across Indian metros and Tier 2 cities. As demand patterns evolve, planners can revisit the model and reshape service zones without needing to build the analysis from scratch. During periods of sustained high diesel prices, this network-level view is the single highest-leverage optimisation available, because it reduces the fuel required per delivery across every route the operation will run.
Fuel price hikes are outside the control of any individual Indian logistics business. The number of litres each delivery consumes, however, is very much within it. Every source of wasted mileage, from imprecise coordinates on a complex Indian address to failed deliveries in a confusing colony to inefficient searches inside a gated community, adds fuel cost that a well-designed location intelligence layer would eliminate. As the IEA has consistently observed, Indian oil demand continues to grow faster than any other major economy, which means volatility in Indian retail fuel prices is unlikely to disappear in the coming years. Operators who invest in a strong Places API foundation now, spanning Potters Maps Places API suite, Location Image API, and the broader Potters Maps places dataset, will be structurally better positioned to absorb the next spike without passing the cost through to customers or watching it eat their margin.
Newsletter signup. Travel with confidence accurate road and traffic information.
© 2026 Potters Maps. All Rights Reserved.